
Left ventricle morphometry in healthy humans. Long axis, contrast enhanced CT study.
Authors: Marian Lorente, C Escalona, M Zabalza-Cerdeiriña, J Álvarez-Moro
Keywords: Left Ventricle. Heart. Computed Tomography. Anatomy. septum thickness
Abstract : The purpose of this study is to describe the morphology of left ventricle of the heart by contrast enhanced Computed Tomography (CT) in patients without cardiac disease. Septum and free wall thickness and diameter of the ventricular cavity were measured at three points; ventricle base, length, apex thickness and angle between the left ventricle and the body axis were also measured. All the measurements were made in systole and diastole in long axis view
06-11-2017
Marian Lorente, C Escalona, M Zabalza-Cerdeiriña, J Álvarez-Moro
0 Comments
| Citation: Marian Lorente, C Escalona, M Zabalza-Cerdeiriña, J Álvarez-Moro. Left ventricle morphometry in healthy humans. Long axis, contrast enhanced CT study.. https://doi.org/10.24175/sbd.2017.000004 |
| Received: November 06, 2017 Accepted: November 06, 2017 Published: November 06, 2017 |
| Copyright: © 2017 Lorente et al. This is an open access article distributed under the terms of the Creative Commons Attribution License (CC BY-NC), which allows, distribution, reproduction in any medium, provided the original author and source are credited and non-commercial use. |
| Funding: I certify that no funding has been received for the conduct of this study and/or preparation of this manuscript. |
| Conflicts of Interest: I have no conflicts of interest to declare |
Left ventricle morphometry in healthy humans. Long axis, contrast enhanced CT study.
C Escalona1, M Zabalza-Cerdeiriña1,2, J Álvarez-Moro3, Marian Lorente1
1 Faculty of Medicine and Health Sciences. Universitat Internacional de Catalunya, Sant Cugat del Vallès, Spain. www.uic.es
2 ICU Unit, Centro Internacional de Medicina Avanzada (CIMA) Barcelona, Spain
3 Servicio de Radiología Clinica Corachan. Barcelona, Spain
Abstract
The purpose of this study is to describe the morphology of left ventricle of the heart by contrast enhanced Computed Tomography (CT) in patients without cardiac disease. Septum and free wall thickness and diameter of the ventricular cavity were measured at three points; ventricle base, length, apex thickness and angle between the left ventricle and the body axis were also measured. All the measurements were made in systole and diastole in long axis view. METHODS. A Spiral Multi Detector Computed Tomography with 16 detectors was used to perform measurements, synchronized with the injection of an ionized solution. Sixty-nine patients were analyzed retrospectively. RESULTS. All results include mean ± S.D., CI 95%, min and max. Summarized means (in mm.) are: Septum-Basal: 12,10 (systole), 9,78 (diastole), Septum-Mid: 13,09 (systole), 9,86 (diastole), Septum-Apical: 11,61(systole), 7,96 (diastole); Free wall-Basal: 13,16 (systole), 8,90 (diastole), Free wall -Mid: 10,91 (systole), 7,95 (diastole), Free wall -Apical: 11,27 (systole), 7,74 (diastole); Lumen-Basal: 35,38 (systole), 42,70 (diastole), Lumen -Mid: 32,97 (systole), 40,54 (diastole), Lumen -Apical: 18,52 (systole), 40,64 (diastole); Base 44,62 (systole), 43,71 (diastole); Length 83,67 (systole), 92,86 (diastole); Apex 8,56 (systole), 3,42 (diastole); Angle 82,46 (systole), 83,07 (diastole).
CONCLUSIONS
Although gold standard in cardiac imaging is Magnetic Resonance Imaging (MRI), CT has been proved to have a great temporal and spatial resolution, and to be a low inter-study, intraobserver and interobserver variability tool for the determination of volume and mass of the left ventricular myocardium in serial studies, allowing describing comprehensively the morphology of left ventricle. Measurements performed in patients without heart disease can be a starting point for the evaluation of ventricle adaptations to multiple exercise or disease.
Key words: Left Ventricle, Heart, Computed Tomography, Anatomy, septum thickness.
1. PURPOSE
This study describes the left ventricle morphometry of the heart by contrast enhanced Multi Detector Computed Tomography (MDCT) in long axis. The authors are not aware of the existence of such a description in these terms in patients without heart disease [1-3]. This method consists of measuring the thickness of the left ventricle myocardium in the septum and free wall and the diameter of the ventricular cavity in systole and diastole in the long axis view, as well as to quantify the length of the left ventricle during systole and diastole and the angle between the left ventricle and the body axis.
2. METHODS
2.1. Materials
The imaging equipment that was applied was Spiral Multi Detector Computed Tomography (SMDCT), Philips Medical Systems scanner, Mx 8000 IDT, multi-slice system, version 5.2 equipped with 16 detectors [4,5]. The measurements were made using the Philips "Extended Brilliance Workspace" Software, version 2.0.
Contrast enhancement was made by the intravenous injection of an ionized solution (Iopromida: Ultravist® 370 mg/l/ml) accompanied by an entry of saline, through a dual syringe attached to a Medrad infusion pump that allowed their control. This injection was performed in coordination with the scanner to ensure that the entry of the contrast spatially and temporally coincided with the image reception.
2.2. Design
It is a retrospective analysis based on the measurements taken from the patients of the Diagnostic Imaging Service of the Centre Internacional de Medicina Avançada (CIMA). Therefore, no patient received any radiation dose corresponding to a CT made for the sole purpose of providing data to this study.
2.3. Population
The target patients of this study were patients without heart disease.
2.4. Sample
Patients who had been performed a heart or coronary CT, and whose results thereof were negative, were considered as patients without heart disease.
The inclusion and exclusion criteria are listed below as follows:
Inclusion criteria: patients with risk factor for coronary heart disease or some altered result in a hemodynamic test.
Exclusion criteria: the existence of heart disease compatible image and an inappropriate image that does not allow automatic reconstruction of the axes [6].
Sample size: The sample initially included 75 patients. Taking into consideration the type of the study and the sample size, a mistake to assume all the variables together is within ± 5% (tolerance = ± 0.05).
Seventy-five patients were enrolled initially, 6 were dismissed by the fact of having an illegible image of the CT that did not allowed to conduct the study or calculate the axes automatically. Therefore, the study finally included 69 patients. Patients in the sample were aged between 29 years (minimum) and 81 years (maximum), with an average of 56.3 years and a standard deviation of 11.4. Outliers are rare (only two patients under 40 years, one with 39 years, and only one patient is over 80 years, namely 81).
As to gender distribution, it is noteworthy that although it is well-known that heart disease does not make gender discrimination and it is the leading cause of death for both men and women, there are gender gaps in terms of diagnosis and treatment. A study performed by the American Heart Association and the American Stroke Association that takes into consideration age, size and other factors states a risk of death from heart disease for women 1.7 times higher than for men [7]. The Statistics Update 2008 of the American Heart Association (AHA) demonstrated that the gender gap in relation to heart diseases is narrow, in some cases prevailing in women rather than in men. This fact comes along with a great difference between the sexes when it concerns the participants of medical studies, as it was shown in the scientific literature, although according to the records, health plans and national and international statistics, such as that of the AHA, the number of women suffering heart diseases accounts approximately 50% of all the patients diagnosed [7].
The present study shows an asymmetric distribution between the genders due to the origin of the sample (the list from which they were consecutively drawn), and reveals a tendency in which females are less studied for heart disease than males. Sixty men (87%) and 9 women (13%) were analyzed. A similar proportion is found in many other scientific studies that do not take into account the differences between genders [8-11]; Juergens [12], featuring identical percentages, with a sample of 30 patients, 25 of whom were men (83%) and 5 women (17%) or Koyama [6], with a sample of 58 patients, 51 of whom were men (88%) and 7 women (12%).
However, there are some references about left ventricle anatomy and function in which gender proportion are compared and seems to be more accurate, as quoted Salton [9] or others [11,13].
2.5. Bioethics
The Bioethics Committee of the Universitat Internacional de Catalunya has been consulted to establish the bioethical aspects of this study. All patients who have completed the CT at CIMA have signed an informed consent after being provided a patient information sheet.
2.6. Measuring instruments
The method for obtaining data encompassed two protocols: A) the protocol established by the CIMA to perform coronary angiography and B) Study protocol and data analysis, prepared in this paper on the basis of relevant scientific studies [4,11,14,15] and in collaboration with specialists in imaging diagnostic having extensive experience in cardiac CT diagnosis. Both protocols are comprehensively described below:
A. CIMA Protocol of CT coronary angiography
Consists of two stages: a clinical examination and premedication, and CT making, both held in the hospital. Clinical examination and premedication is made in order to optimize the image quality when performing cardiac CT scans, consisting in a protocol of premedication for CT coronary angiography starting with a 12-lead ECG; if the heart rate (HR) was higher than 65 beats / min. and blood pressure (BP) was less than 110/60 mmHg, Sumial® (propranolol) 40 mg. was administered orally; if HR was between 64 and 55 beats / min, Sumial® 20 mg was administered orally. Measurements of the HR and BP values were made before taking the medication and 1 hour after.
This part of the protocol is very important because the maintenance of a HR below 60 beats per minute is necessary to avoid artifacts caused by the motion of the heart, that hinders a further implementation of a correct diagnosis or study, which may lead to necessity of retest.
The second stage is made just before starting the test and at least within one hour after taking Sumial®; another measurement of HR and BP was carried out, and the result thereof was recorded together with the elapsed time.
When starting the CT, an iodine based contrast solution was injected intravenously (all patients were informed of sensations it causes, and the actions to take). Then, the CT scan was conducted under coordination with the ECG in cardiac diastolic phase (0%), and then in successive stages (40%, 75% and 80%).
Scanning parameters were as follows:
• Collimation: 16 x 0.75 mm
• Table advance 1 mm
• 1 rotation / 0,42 s.
• 38 slices / s.
• Slice thickness: 1 mm.
• Increase: 0.5 mm.
• Pitch: 0.297
• Voltage: 385 mA, 140 kV
• Resolution: UF Detail
B. Study protocol and data analysis
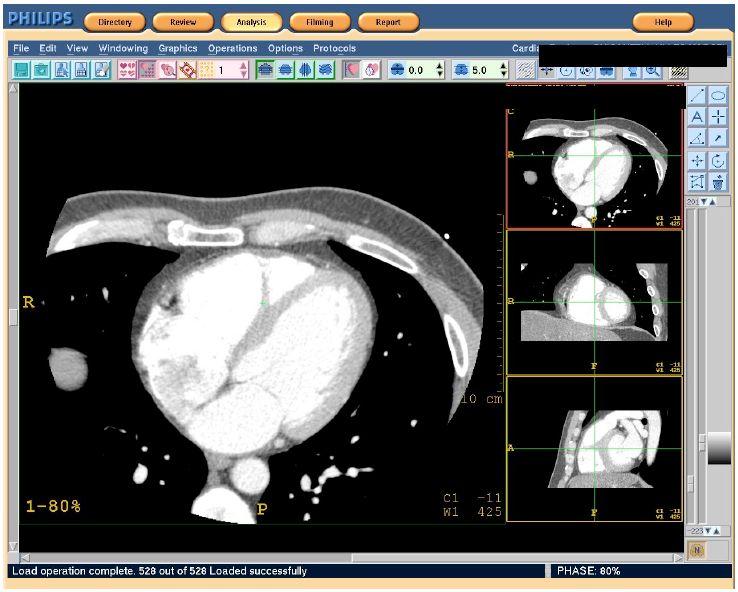
Figure 1. Initial screen of the operating console
The software used allows exploration of the heart by selecting the "Cardiac review" command, which provides detailed images of the heart throughout the cardiac cycle of a patient as well as the dynamic behavior of the heart.
The cardiac images used in the analysis were obtained from cardiac CT scanner applying the protocol established by the manufacturer, in which the heart raw data and the ECG signal were simultaneously recorded to be retrospectively reconstructed in phases.
The phases are defined according to the percentage of the cardiac cycle between two R waves of ECG, synchronized and combined with the CT image. The images are captured during systolic (40%) and diastolic (80%) phases accordingly.
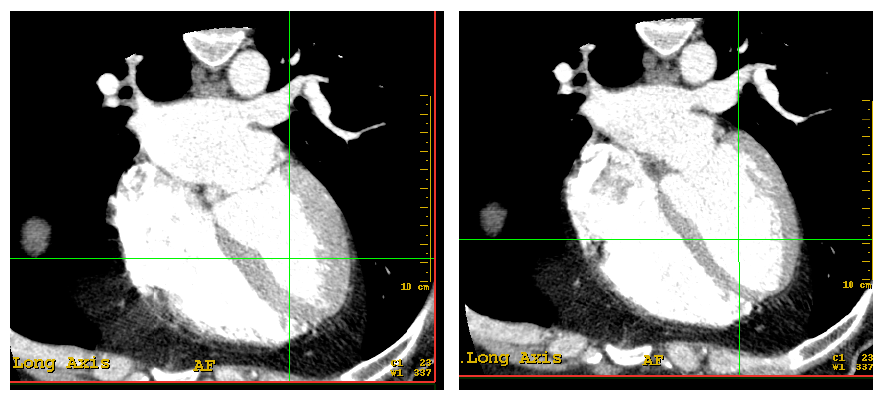
Figures 2 and 3. Images in the long axis of one same patient's heart in the phases of systole and diastole
1. Selection of the phase of the cardiac cycle (systole or diastole).
2. Measurements in the long axis; to compare them in different stages, the data were taken sequentially following the same protocol in the both stages.
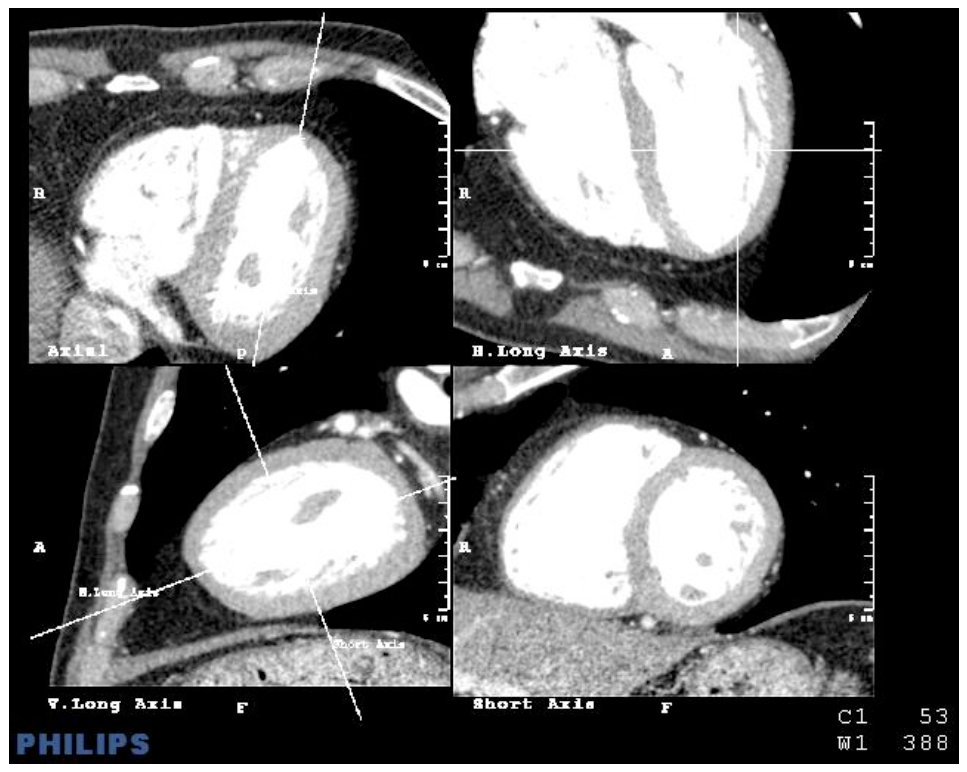
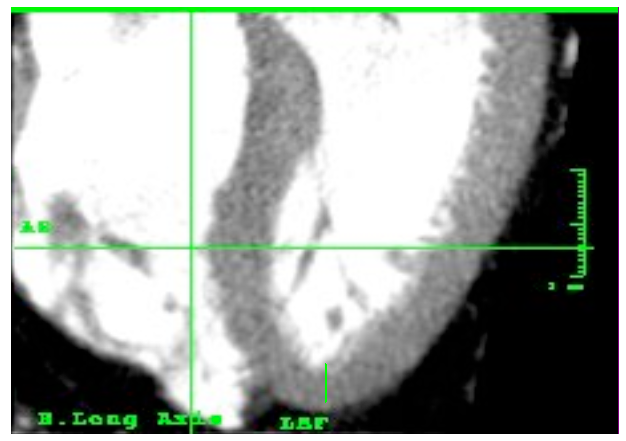
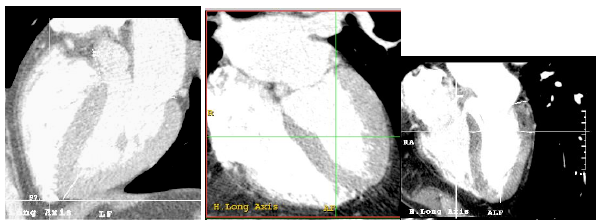
Figure 4. Image of the screen in which four images of the heart can be simultaneously explored: axial, vertical long axis, horizontal long axis and short axis.
The command "Cardiac axes" calculates the cardiac axes automatically, although it can also be adjusted manually. The study data is based on the axes calculated automatically, avoiding manual adjustments that may produce inaccuracy due to the multiplicity of different axes that could be used; this would decrease precision.
Measures Statement
Similarly to most of the functional studies of the heart, and following the publications of expert committees [14,16,17], the left ventricle was measured at three levels: baseline, middle and apical, corresponding to 25%, 50% and 75% of the length of the left ventricle (dividing from the mitral annulus to the apex of the heart into four equal parts).
In each of these levels, the measurements have been taken in (1) septum wall, (2) free wall, (3) inner diameter (lumen). These measurements result to a morphological uniformity in all studied cases, regardless of the size of the heart, as well as of anatomical variations that may arise. The measurements were taken in the long axis of the heart, measuring the walls and the axis situated practically perpendicular to it, similar to the method of the midline [15].
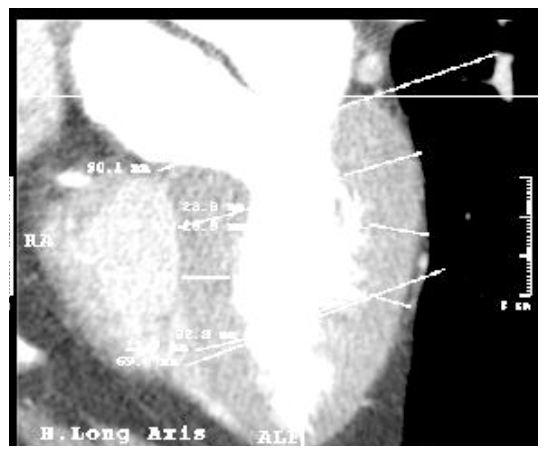
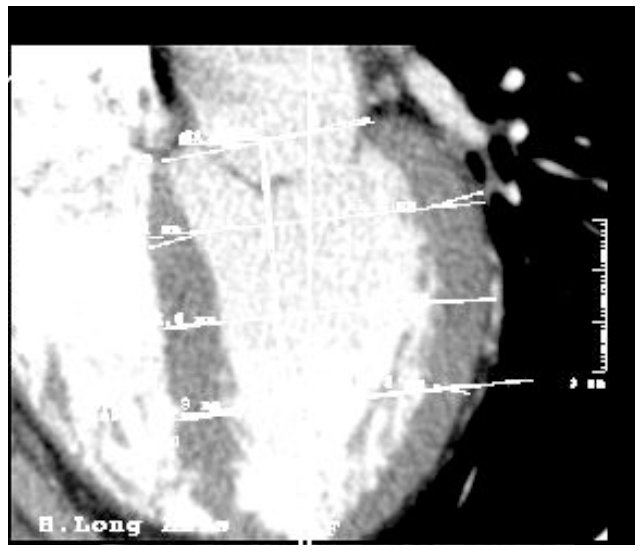
Figure 5. Tomographic imaging of the heart in the long axe. The base of the left ventricle has been lined, from its central point to the apex the ventricle length has been calculated and, according to this, the three altitudes have been determined (baseline, middle and apical).
Figure 6. Tomographic imaging of the heart in long axis showing calculations to determine the three levels.
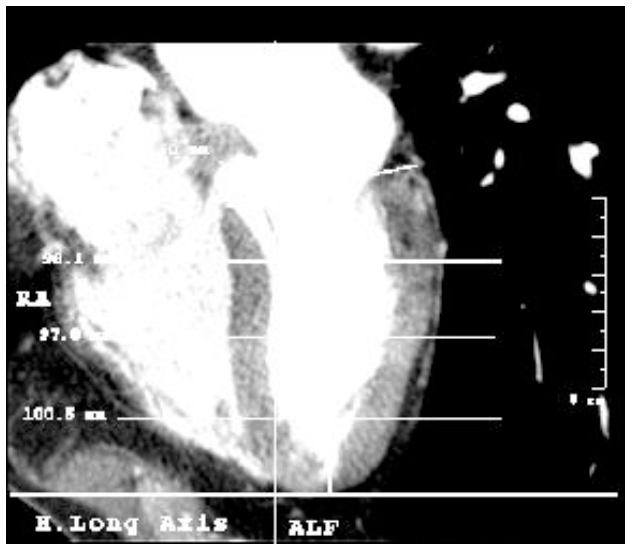
In addition to those three, four more measurements were registered: (4) the length of the base of the heart from the uppermost portion of the interventricular septum, corresponding to the membranous (thinner) part, to the beginning of the free wall; (5) the length of the ventricle, from the midpoint of the base to the apex [16] [this measure was used to establish the percentages (25%, 50% and 75%) and determine the level line (baseline, middle and apical]. This line is also considered the long axis of the left ventricle and was used as a reference to measure (6) body-ventricle angle, and (7) the thickness of the apex, measured from the apex tip of the cavity to the tip of the heart.
Figure 7. Tomographic imaging of the heart in long axis. Note the line that forms the length of the left ventricle through the midpoint of the base and apex.
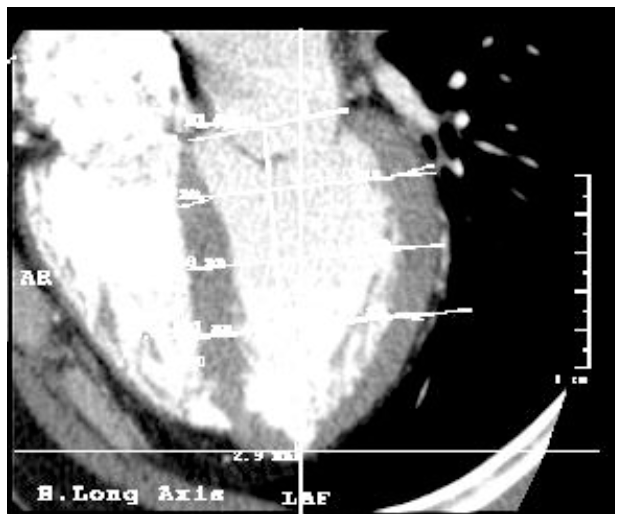
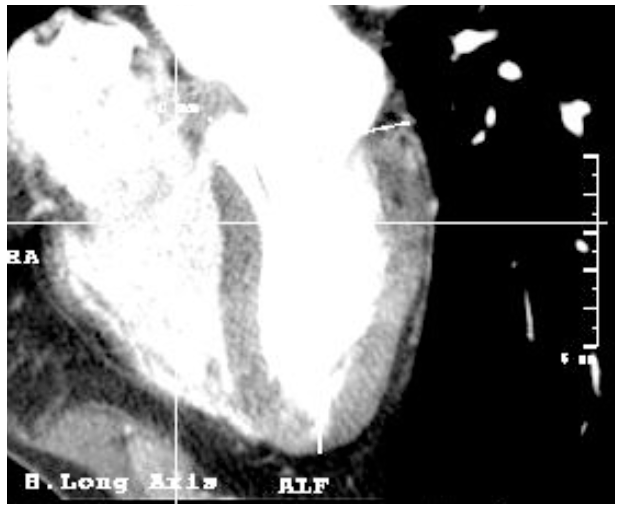
Figure 8. Tomographic imaging of the heart in the long axis. Note the angle calculated between the line forming the length of the left ventricle and the body axis determined by the axis of the CT.
Figure 9. Tomographic imaging of the heart in the long axis. The lower area of the ventricular wall forms the apex, from the end of the cavity to the tip of the heart.
2.7. Inter-and intraobserver differences
Methodologically, the CT has been proved to be a tool with a low inter-study, intraobserver and interobserver variability for the determination of volume and mass of the left ventricular myocardium in serial studies [17-21]. Additionally, all the data collection was carried out by the same observer, which eliminated possible inter-observer inaccuracy.
2.8. Statistical analysis
All the collected data have been analyzed using SPSS software package version 16.0.
3. RESULTS
All the measurements have been registered in systole and diastole. Mean, Standard Deviation (SD), Confidence Interval 95% (CI 95%), minimum (min) and maximum (max) are displayed in the following tables for the three levels of septum, free wall and lumen. Base, length, apex and angle are also shown.
| SEPTUM | SYSTOLE | DIASTOLE | |
| BASAL | Mean±S.D. | 12,10±3,81 | 9,78±2,96 |
| CI 95% | 11,10-12,93 | 8,99-10,38 | |
| Min-Max | 2,00-20,00 | 2,90-16,80 | |
| MID | Mean±S.D. | 13,09±2,73 | 9,86±2,03 |
| CI 95% | 12,35-13,51 | 9,31-10,23 | |
| Min-Max | 7,80-22,10 | 5,90-18,00 | |
| APICAL | Mean±S.D. | 11,61±2,29 | 7,96±2,00 |
| CI 95% | 11,06-12,17 | 7,43-8,38 | |
| Min-Max | 6,70-18,40 | 4,80-16,70 | |
| TABLE 1. Thickness of the septum(in mm.) at the three heights in systole and diastole. | |||
| FREE WALL | SYSTOLE | DIASTOLE | |
| BASAL | Mean±S.D. | 13,16±3,94 | 8,90±2,17 |
| CI 95% | 12,21-14,14 | 8,31-9,30 | |
| Min-Max | 5,50-22,80 | 4,40-17,30 | |
| MID | Mean±S.D. | 10,91±2,89 | 7,95±1,39 |
| CI 95% | 10,16-11,56 | 7,57-8,19 | |
| Min-Max | 6,30-20,80 | 5,10-12,60 | |
| APICAL | Mean±S.D. | 11,27±3,09 | 7,74±1,48 |
| CI 95% | 10,53-12,02 | 7,35-8,04 | |
| Min-Max | 5,90-21,20 | 4,10-11,20 | |
| TABLE 2. Thickness of the free wall (in mm.) at the three heights in systole and diastole. | |||
| LUMEN | SYSTOLE | DIASTOLE | |
| BASAL | Mean±S.D. | 35,38±7,17 | 42,70±8,06 |
| CI 95% | 33,61-37,10 | 40,74-44,67 | |
| Min-Max | 22,30-57,00 | 19,70-63,70 | |
| MID | Mean±S.D. | 32,97±6,65 | 40,54±6,95 |
| CI 95% | 31,49-34,69 | 38,74-42,10 | |
| Min-Max | 16,40-55,60 | 13,30-59,20 | |
| APICAL | Mean±S.D. | 18,52±6,70 | 40,64±5,54 |
| CI 95% | 16,90-20,14 | 39,35-42,04 | |
| Min-Max | 3,70-36,80 | 27,70-52,50 | |
| TABLE 3. Lumen of the left ventricle (in mm.) at the three heights in systole and diastole. | |||
| SYSTOLE | DIASTOLE | ||
| BASE | Mean±S.D. | 44,62±4,56 | 43,71±4,70 |
| CI 95% | 43,49-45,75 | 42,56-44,87 | |
| Min-Max | 36,20-54,30 | 32,40-53,30 | |
| LENGTH | Mean±S.D. | 83,67±7,82 | 92,86±9,16 |
| CI 95% | 81,57-85,24 | 90,50-94,83 | |
| Min-Max | 65,50-113,30 | 72,00-120,30 | |
| APEX | Mean±S.D. | 8,56±5,29 | 3,42±2,21 |
| CI 95% | 7,32-9,91 | 2,90-3,99 | |
| Min-Max | 1,80-30,10 | 0,80-15,40 | |
| ANGLE | Mean±S.D. | 82,46±13,23 | 83,07±12,06 |
| CI 95% | 79,24-854,69 | 80,13-86,02 | |
| Min-Max | 45,00-126,00 | 53,00-123,00 | |
| TABLE 4. Measures of base and length, thickness of apex (in mm.) and angle (in degrees) between left ventricle and the body in systole and diastole. | |||
The study of the morphometry and morphology is of paramount importance for cardiac function and its relation with pathology. The idea that the shape and the function are closely interconnected is fully accepted today. In the field of heart study, already in 1971 Lewis and Sandler [22] demonstrated by means of angiocardiograms the existence of a relationship between the changes in the left ventricular dimensions and the ejection fraction; from then on, many changes have happened on the field of heart study.
Systematization of the complex reality of such correlation is essential to simplify existing scientific data without losing any important information. This study of morphology is aimed at generalization and standardization of some highly variable elements.
In the field of imaging diagnostic, as in any other medical and surgical discipline, the mastery of equipment is hampered by a constant appearance of new medical tools, making the preceding generations of the medical equipment obsolete. That inevitably results in impeding to carry out fundamental and widespread studies based on reasonably stable criteria, because new protocols and standardization procedures must be created constantly for such new tools.
Daily practice and experience of cardiology clinicians and radiologists allow the detection weak points and the possibility to improve the process of optimization that can serve as a good starting point for further research. This is demonstrated by the fact that new protocols are being created for data analysis related to the search of a closer approximation to reality [23,24], improved accuracy in measurements [25,26] and time reduction of data analysis [27-29].
All this leads to the necessity of some new methodologies and protocols that must be investigated and evaluated. This study intends to create and develop a new methodology for the study of morphological parameters of the left ventricle and it focuses on the morphological and morphometric study of the heart. This study can serve as a basis for a future deeper investigation on the characteristics of cardiac function (systolic volume, end-diastolic volume, ejection fraction, etc.)
3.1. Septum wall
Since the septum has thickness variations depending on the level where it is measured, three measurements were made (base, mid and apical); despite, few references describe them. Testut [30] describes its maximum thickness near the apex in 10 to 15 mm (cadaver data) and Cardiology [16] describes 12 ± 2mm in systole and 8 ± 2mm in diastole.
Some studies quantify the average thickness of the ventricular walls considering the left ventricle in short axis as an ellipse of regular walls. A series of CT slices are made, each one is quantified and finally all of them are added to get the total volume. Koyama [6] obtained by this method a left ventricular thickness of 12.0 mm ± 1.7 in diastole in non infarcted regions.
Bruzzi [31] made a proposal divided into two articles about when, why and how to examine the heart during a CT scan of the chest, arguing that there are standardizations of the measures of myocardial magnetic resonance and echocardiography, but there are not in Computed Tomography; Foale is cited sentencing that the right ventricular thickness is 3 to 4 mm., which is approximately three times thinner than the left ventricle, corresponding to 9 to 12 mm.
In relation to this study, the data are comparable, although there are slight differences in methodology and the type of patients. The measures are similar, which guides that have been taken and processed appropriately.
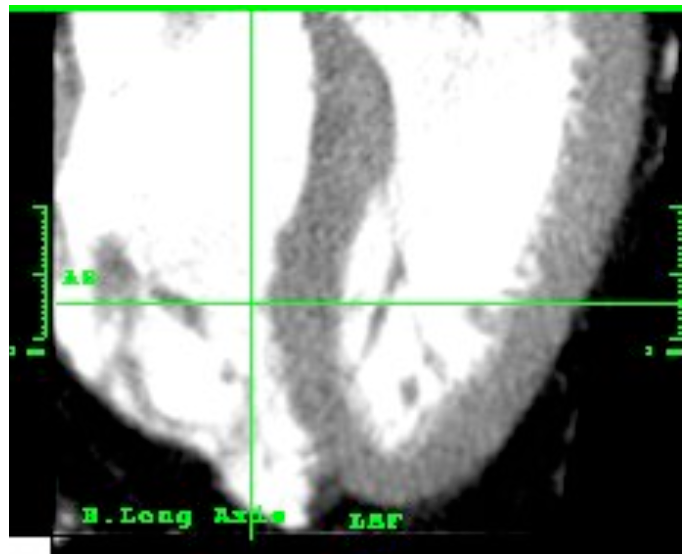
Figure 10. Vision of left ventricle in long axis. The two portions of the septum (membranous and muscular) and its shape can be observed.
3.3. Free wall
The free wall corresponds to the wall located diametrically opposite to the interventricular septum in the long axis view.
Hurst jointly describes the walls of the left ventricle, without distinction of septum or free wall, with a thickness of 8 to 15 mm [32]. Brandenburg, in Cardiology, differentiates between phases of cardiac cycle, and states a thickness between 14 and 20 mm. in systole, and 8 and 10 mm. in diastole [16]. Mayo Clinic describes in its Concise Book a wall thickness of the left ventricle measured in the short axis in systole of 13 mm [33]. Data from this study (systole: 13.16, 10.91, 11.27 mm and diastole 8.90, 7.95, 7.74 for basal, mid and apical heights) show thinner wall values than those described.
3.4. Lumen
The lumen of the left ventricle has been studied through the internal diameter in the vision of long axis. Keeping the system used for the septum and the free wall, lumen has been studied in three heights along the entire left ventricle.
The classical anatomical book Testut, focus primarily on the capacity or volume of the ventricle, rather than the diameter, stating a capacity between 143 and 212 cubic centimeters [30]. Currently, data volumes and capacities are preferentially used in functional or physiological studies of heart to determine whether the heart is performing its function correctly, or if there is dysfunction; the most commonly used are end-systolic and end diastolic volumes, ejection fraction and stroke volume.
However, the diameter is an important datum and may be of clinical utility and prognostic, as stressed Tarasoutchi who by the multivariate analysis showed that the likelihood of developing symptoms in aortic insufficiency within 10 years post-surgery was 58% for patients with left ventricular diastolic diameter of 70 mm and 76% for patients with systolic diameter of 50 mm, and the linear regression analysis identified the end-systolic diameter and age as the most predictive indicator, specific but not sensitive, to the development of symptoms [34].
Other authors, such as Brandenbrug in Cardiology [16] defines the lumen of the left ventricle in terms of the radius in a cut in short axis, describing as a reference value 17 mm. inner radius, corresponding to 34 mm. diameter, without specifying when the cardiac cycle (systole or diastole) or valued heigth.
3.5. Base
Left ventricle base of the heart is not frequently measured. Some works have studied the length and width of the entire heart, as it was made by Bizot in Testut studies [30], where a variation at different ages and genders were described. According to our measurements, the base of the left ventricle has a mean length of 44.62 mm in systole and 43.71 mm in diastole.
This difference in the length of the left ventricle base between systole and diastole is little, and may result from the presence of the fibrous skeleton of the heart, a fibrous tissue surrounding the ventricular orifices that serves to fix the muscle insertions of atrium and ventricle and valvular tissue, that is more developed in the left ventricle than in the right ventricle. The presence of such fibrous tissue (and not muscular) reduces mobility, becoming a fixed anchor point rather than a broad point of contractility.
3.6. Length
With respect to the length of the left ventricle, anatomy books and scientific articles mostly refer to the length of the whole heart (not only the ventricle) of a dead human body (not in vivo), that reflects the measurement thereof in the absence of muscle contraction.
Testut classifies the length of the entire heart attending to age. The closest range to our study sample (56 years) is between 50 and 79 years, and gives a value of 105 mm. Brandenburg maintains that the length of the left ventricle is 75 ± 10mm [16], although no benchmarks are pointed. The alleged length of the heart in this study is higher in both systole and diastole (83.67 mm and 92.85mm respectively).
Differences between the results obtained in this study with those contained in the scientific literature might probably result from the differences of the heart condition when being measured: first figures belong to the measurement of the heart of dead bodies, with consequent loss of muscular tone, blood content and function, while in this work all the measurements taken into consideration were made in vivo. This fact justifies a difference (8 to 17 mm) existing between the measurements asserted in the scientific literature [16,30,33] and made in the study. Moreover, there are no generally accepted benchmark criteria to determine the length of the entire human heart, which also might have brought some divergence in scientific results.
3.7. Heart-body Angle
A heart-body angle is usually defined in the scientific literature as the angle between the longitudinal axis of the whole heart related to the body axis; although not exactly identical measures, since in this study we are focused on the left ventricle, they are sufficiently rough to be taken as a reference for the purpose of comparison. Testut [30] cites 40 degrees in relation to the value of horizontal angle, which corresponds to 50 degrees with respect to the longitudinal axis of the body.
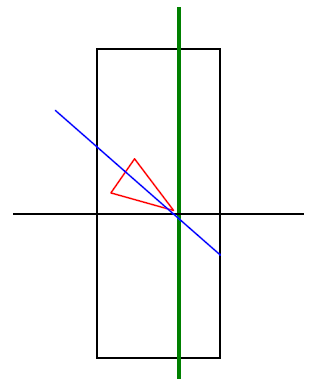
Figure 11. Outline of the angle between the left ventricle (represented as a triangle) in relation to the body axis (green line).
Results show wide interpersonal differences in the angle (with an average angle of 82.46 ° and a standard deviation ± 13.23), with a minimum angle of 45 ° and a maximum of 126 °, representing a range of 81°, which indicates the high variability of the heart's position in the mediastinum. This variability could affect cardiac tests if they do not take into account the position and, therefore, the exact anatomic area that is being explored. In the case of anatomical or morphological evidence, such as echocardiography, it is easier to contextualize the heart, but in functional tests using surface anatomical landmarks, as in the electrocardiogram, this contextualization can be done using the stethoscope to determine the position of the hole heart, and an imaging test may show the position of the heart and electrodes, as long as a very accurate study is needed.
It would be of interest to make a research in order to compare changes in the registration of the electrocardiogram depending on the angle of the heart. It would also demonstrate how appropriate would be including into the protocol of one imaging electrocardiography the variability of the angle between the heart and the body referred to in this study.
Figure 12. Variability of the axis between the left ventricle and the body axis in different people without heart disease.
Besides the high variability, this parameter in the sample does not present a normal distribution (which mathematically drives to the use of non parametric tests), oppositely to many other human characters. It would be interesting to study with larger sample, data regarding to the position of the heart in the mediastinum, and the possible consequences of its variations. Another interesting fact is that the motion of the heart happening between systole and diastole does not significantly affect the angle of the left ventricle with respect to the body axis.
3.8. Apex
The apex corresponds to the confluence point of free and septal walls of left ventricle. The thickness of the apex is calculated from the apex of the ventricular cavity to the apex of the heart muscle itself.
Figure 13. Tomographic left ventricle with the apex
The apex was measured in systole and diastole, showing an average thickness of 8.6 mm and 3.4 mm respectively. Fuster, on Hurst [32], asserts an approximate thickness of 2 mm (it shall be noted that these are figures are related to a dead human body). Cardiology [16] indicates a thickness of 8 mm in diastole and 12 mm. in systole (both higher than those found in this study). It would be important to know the method applied to measure the apex and the sample studied.
Contraction causes the fibers to shorten; therefore, there is a significant length reduction in systole of 150%. The great difference between the length of the apex in the systole and diastole may show the importance of this part of the heart to eject blood.
These results are consistent with the theory developed by Torrent-Guasp [35-37] on the sequence of cardiac contraction of helical shape, supported and confirmed by other studies using techniques of diagnostic imaging that highlights the importance of optimal orientation cardiac muscle fibers to function correctly and the impact of a loss of it as a result of heart failure [38].
4. CONCLUSIONS
Using contrast enhanced computed tomography (CT) we have been able to measure in the long axis: base and length of the left ventricle, and angle between it and the body axis, thickness of the walls of the left ventricle in three levels, and the thickness of the apex. All these measurements correspond to patients without a heart disease.
In future papers, we will analyze statistically the differences among the different levels and the differences between systole and diastole, so as to quantify how much contributes each part to the global contraction of the heart and therefore to cardiac function. Another future line might be the assessment of heart adaptations responding to different physical activities, either using CT but also the same protocol with echocardiography.
References
(1) Organización Mundial de la Salud. Informe sobre la Salud en el Mundo 2003: forjemos el futuro. Ginebra: OMS; 2003.
(2) Sans S, Kesteloot H, Kromhout D, et al. The burden of cardiovascular disease mortality in Europe. Task Force on the European Society of Cardiology on Cardiovascular Mortality and Morbidity Statistics in Europe. Eur Heart J 1997;18:1231-48.
(3) Tunstall-Pedoe H, Kuulasmaa K, Mahonen M, Tolonen H, Ruokokoski E, Amouyel P.
Contribution of trends in survival and coronary-event rates to changes in coronary heart disease mortality: 10-year results from 37 WHO MONICA Project populations. Lancet 1999;353:1547.
(4) Cerqueira MD, Weissman NJ, Dilsizian V, Jacobs AK, Kaul S, Laskey WK, et al. Standardized myocardial segmentation and nomenclature for tomographic imaging of the heart: a statement for healthcare professionals from the Cardiac Imaging Committee of the Council on Clinical Cardiology of the American Heart Association. Circulation 2002 Jan 29;105(4):539-542.
(5) Cui W, Anno H, Kondo T, Guo Y, Sato T, Sarai M, et al. Right ventricular volume measurement with single-plane Simpson's method based on a new half-circle model. Int J Cardiol 2004 Apr;94(2-3):289-292.
(6) Koyama Y, Matsuoka H, Mochizuki T, Higashino H, Kawakami H, Nakata S, et al. Assessment of reperfused acute myocardial infarction with two-phase contrast-enhanced helical CT: prediction of left ventricular function and wall thickness. Radiology 2005 Jun;235(3):804-811.
(7) Ferris A, Robertson RM, Fabunmi R, Mosca L, American Heart Association, American Stroke Association. American Heart Association and American Stroke Association national survey of stroke risk awareness among women. Circulation 2005 Mar 15;111(10):1321-1326.
(8) Kwon TD, Kim KH, Ryu HG, Jung CW, Goo JM, Bahk JH. Intra- and extra-pericardial lengths of the superior vena cava in vivo: implication for the positioning of central venous catheters. Anaesth Intensive Care 2005 Jun;33(3):384-387.
(9) Salton CJ, Chuang ML, O'Donnell CJ, Kupka MJ, Larson MG, Kissinger KV, et al. Gender differences and normal left ventricular anatomy in an adult population free of hypertension. A cardiovascular magnetic resonance study of the Framingham Heart Study Offspring cohort. J Am Coll Cardiol 2002 Mar 20;39(6):1055-1060.
(10) Cain PA, Ahl R, Hedstrom E, Ugander M, Allansdotter-Johnsson A, Friberg P, et al. Physiological determinants of the variation in left ventricular mass from early adolescence to late adulthood in healthy subjects. Clin Physiol Funct Imaging 2007 Jul;27(4):255-262.
(11) Tandri H, Daya SK, Nasir K, Bomma C, Lima JA, Calkins H, et al. Normal reference values for the adult right ventricle by magnetic resonance imaging. Am J Cardiol 2006 Dec 15;98(12):1660-1664.
(12) Juergens KU, Grude M, Maintz D, Fallenberg EM, Wichter T, Heindel W, et al. Multi-detector row CT of left ventricular function with dedicated analysis software versus MR imaging: initial experience. Radiology 2004 Feb;230(2):403-410.
(13) Engblom H, Hedstrom E, Palmer J, Wagner GS, Arheden H. Determination of the left ventricular long-axis orientation from a single short-axis MR image: relation to BMI and age. Clin Physiol Funct Imaging 2004 Sep;24(5):310-315.
(14) Edwards WD, Tajik AJ, Seward JB. Standardized nomenclature and anatomic basis for regional tomographic analysis of the heart. Mayo Clin Proc 1981 Aug;56(8):479-497.
(15) Sheehan FH, Bolson EL, Dodge HT, Mathey DG, Schofer J, Woo HW. Advantages and applications of the centerline method for characterizing regional ventricular function. Circulation 1986 Aug;74(2):293-305.
(16) Brandenburg RO. Cardiology : fundamentals and practice. Chicago: Year Book Medical Publishers; 1987.
(17) Roig E, Georgiou D, Chomka EV, Wolfkiel C, LoGalbo-Zak C, Rich S, et al. Reproducibility of left ventricular myocardial volume and mass measurements by ultrafast computed tomography. J Am Coll Cardiol 1991 Oct;18(4):990-996.
(18) Fischbach R, Juergens KU, Ozgun M, Maintz D, Grude M, Seifarth H, et al. Assessment of regional left ventricular function with multidetector-row computed tomography versus magnetic resonance imaging. Eur Radiol 2007 Apr;17(4):1009-1017.
(19) Bloomer TN, Plein S, Radjenovic A, Higgins DM, Jones TR, Ridgway JP, et al. Cine MRI using steady state free precession in the radial long axis orientation is a fast accurate method for obtaining volumetric data of the left ventricle. J Magn Reson Imaging 2001 Dec;14(6):685-692.
(20) Sievers B, Kirchberg S, Franken U, Puthenveettil BJ, Bakan A, Trappe HJ. Visual estimation versus quantitative assessment of left ventricular ejection fraction: a comparison by cardiovascular magnetic resonance imaging. Am Heart J 2005 Oct;150(4):737-742.
(21) Juergens KU, Seifarth H, Maintz D, Grude M, Ozgun M, Wichter T, et al. MDCT determination of volume and function of the left ventricle: are short-axis image reformations necessary? AJR Am J Roentgenol 2006 Jun;186(6 Suppl 2):S371-8.
(22) Lewis RP, Sandler H. Relationship between changes in left ventricular dimensions and the ejection fraction in man. Circulation 1971 Oct;44(4):548-557.
(23) Nixdorff U, Feddersen I, Voigt JU, Flachskampf FA. Three-dimensional echocardiography: rational mode of component images for left ventricular volume quantitation. Cardiology 2005;104(2):76-82.
(24) Vogel-Claussen J, Finn JP, Gomes AS, Hundley GW, Jerosch-Herold M, Pearson G, et al. Left ventricular papillary muscle mass: relationship to left ventricular mass and volumes by magnetic resonance imaging. J Comput Assist Tomogr 2006 May-Jun;30(3):426-432.
(25) Suzuki S, Furui S, Kaminaga T, Yamauchi T, Suzuki D, Kuwahara S, et al. Accuracy and efficiency of left ventricular ejection fraction analysis, using multidetector row computed tomography: effect of image reconstruction window within cardiac phase, slice thickness, and interval of short-axis sections. Circ J 2006 Mar;70(3):289-296.
(26) Strugnell WE, Slaughter RE, Riley RA, Trotter AJ, Bartlett H. Modified RV short axis series--a new method for cardiac MRI measurement of right ventricular volumes. J Cardiovasc Magn Reson 2005;7(5):769-774.
(27) Muhlenbruch G, Das M, Hohl C, Wildberger JE, Rinck D, Flohr TG, et al. Global left ventricular function in cardiac CT. Evaluation of an automated 3D region-growing segmentation algorithm. Eur Radiol 2006 May;16(5):1117-1123.
(28) Ordas S, Frangi A. Automatic Quantitative Analysis of Myocardial Wall Motion and Thickening from Long-and Short-Axis Cine MRI Studies. Conf Proc IEEE Eng Med Biol Soc 2005;7:7028-7031.
(29) Montaudon M, Laffon E, Berger P, Corneloup O, Latrabe V, Laurent F. Measurement of cardiac ventricular volumes using multidetector row computed tomography: comparison of two- and three-dimensional methods. Eur Radiol 2006 Oct;16(10):2341-2349.
(30) Testut L, Latarjet A. Tratado de anatomía humana. Barcelona: Salvat; 1978.
(31) Bruzzi JF, Remy-Jardin M, Delhaye D, Teisseire A, Khalil C, Remy J. When, why, and how to examine the heart during thoracic CT: Part 1, basic principles. AJR Am J Roentgenol 2006 Feb;186(2):324-332.
(32) Fuster V, Alexander RW, O'Rourke RA. Hurst el corazón. 10ª ed. Madrid: McGraw-Hill; 2002.
(33) Murphy JG. Mayo Clinic Cardiology: Concise Textbook. 3ª ed. Canada: Mayo Clinic Scientific Press; 2006.
(34) Tarasoutchi F, Grinberg M, Spina GS, Sampaio RO, Cardoso LF, Rossi EG, et al. Ten-year clinical laboratory follow-up after application of a symptom-based therapeutic strategy to patients with severe chronic aortic regurgitation of predominant rheumatic etiology. J Am Coll Cardiol 2003 Apr 16;41(8):1316-1324.
(35) Kocica MJ, Corno AF, Lackovic V, Kanjuh VI. The helical ventricular myocardial band of Torrent-Guasp. Semin Thorac Cardiovasc Surg Pediatr Card Surg Annu 2007:52-60.
(36) Ballester-Rodes M, Flotats A, Torrent-Guasp F, Carrio-Gasset I, Ballester-Alomar M, Carreras F, et al. The sequence of regional ventricular motion. Eur J Cardiothorac Surg 2006 Apr;29 Suppl 1:S139-44.
(37) Carreras F, Ballester M, Pujadas S, Leta R, Pons-Llado G. Morphological and functional evidences of the helical heart from non-invasive cardiac imaging. Eur J Cardiothorac Surg 2006 Apr;29 Suppl 1:S50-5.
(38) Coghlan C, Hoffman J. Leonardo da Vinci's flights of the mind must continue: cardiac architecture and the fundamental relation of form and function revisited. Eur J Cardiothorac Surg 2006 Apr;29 Suppl 1:S4-17.
This paper belongs to a comprehensive study about the morphometry of the left ventricle. Data from measurements have been analyzed and statistically compared in systole and diastole, long and short axis and at three different heights. Future papers can be submitted to complement the data provided, mainly comparing the structural differences between systole and diastole, the results obtained in long and short axis view, or among different positions in the ventricle. Our will is to contribute to a better knowledge of human non pathologic heart, with the hope of further studies about heart adaptations to different exercises or diseases.